
How an AI-First Rebuild Blew Past Pawssum’s Targets
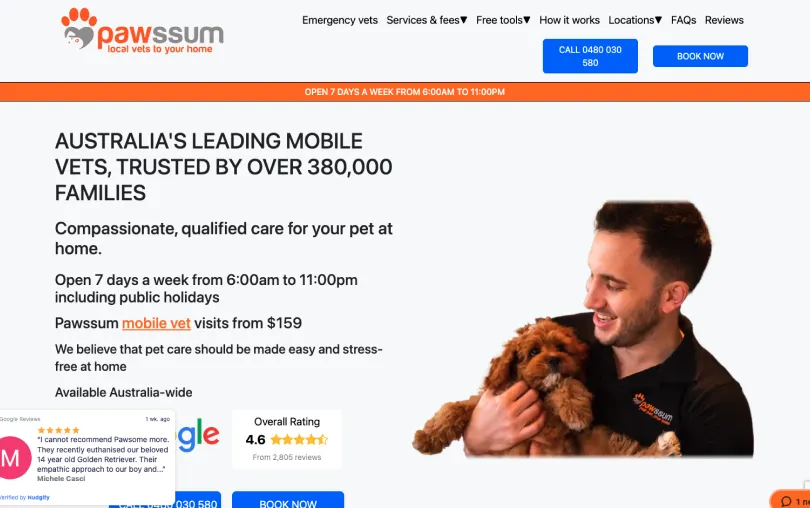
Pawssum, Australia’s largest mobile vet service, serving 380,000+ pet owners nationwide, has partnered with OMG for 10 months.

10%
increase in overall business revenue
10%
increase in daily paying customers
5%
increase in invoice value per customer
Services
Industries
- Professional Services
Challenges
Internal
- Huge demand from 190+ partner clinics for localised messaging and dynamic pricing.
- Financial pressure from the owner and 200+ partner vets due to an outdated keyword-focused strategy with a significantly increased CPA.
- The hack in October 2025 completely screwed up the account learnings, causing a 56% YoY drop in leads.
External
- 2025 reached an all-time high of 3,793 independent local vets – a massive increase in competition
- 22-30% of dog and cat owners reduced vet visits due to financial hardship and looked for natural or DIY treatments.
Advertising
- Search queries now read like questions, how-tos, personal conversations; stacking attributes like “cheap”, “licensed”, “location”,” compassionate “, “after hours”, “why”.
Our Approach
1) Our Objectives:
PERIOD: (01 Jan 26 – 30 June 26 vs last year)
“Prove early Google’s AI delivers. Recover quickly from years of decline and the hack. Grow sustainably within the same budget.”
- Scale quality leads by 10% while meeting every region- and service-level CPL target, ensuring full partner satisfaction nationwide.
- Acquire more brand equity with display and YouTube ads to achieve at least 5% growth in daily paying customers
- Leverage Google AI & automation solutions to lighten Pawssum’s creative workload and get ready for the next wave of Google’s Agentic Marketing, effectively decreasing billable manual tasks by 40% to focus on high-level planning.
2) My Proposed KPIs in 6 months
Business KPIs with support from OMG:
- 10% increase in daily paying customers (from 59 to 65).
- At least a 10% increase in overall business revenue.
Conservative Google KPIs
- About a 10% YoY increase in high-quality leads from 27,000 to 30,000.
- About a 10% YoY decrease in CPL from ($12 to $10.8)
Collaboration & AI Adoption KPIs
90%+ Optiscore
Search
- 80% campaign with broad match
- 80% AI Max adoption at the campaign level
- 80% Excellent Search ad strength rating
Pmax
- 70% Excellent asset group strength rating
- 100% asset groups with Google audience best practice
Data
- 90% audience match rate of actual paying customers
3) Rationale
I justify these KPIs because Google Advertising accounts for nearly 80% of total revenue (based on 1PD). The KPIs align closely with insights from the Google Performance Planner tool, reflecting a conservative approach.
Additionally, I utilise detailed UTM tagging to comprehensively track the true values across all channels.
Strategy & Execution
From Keyword To Intent-Rich, AI-Powered Structure
I utilise 2 internal Gemini-powered forecast models and compare them with Performance Planner to generate confident, conservative forecasts.
→ Boosts forecast accuracy and confidence in planning.
I went from 27 campaigns (25 Search + 1 Video + 1 Display) to (24 Search + 22 Pmax + 9 Demand Gen) to target Mobile VET, Emergency, and Euthanasia across different states and campaigns, to control local messaging and dynamic pricing. I got permission for a 15% budget headroom if CPL is achieved.
→ 83%+ of campaigns use Max Conv. with tCPA for better control and profit.
Prepare Learnings For AI For Maximum Signals
I uploaded service-specific customer lists for each campaign, rather than using a master list of converters, to create a “hyper-specific profile” of our target for each service line, alongside GA4 and Google Ads data. I also enabled Google Tag Gateway to boost data accuracy.
→ Customer Match Lists have a 100% match rate and boost targeting across Search (26.2k), YouTube (25.5k), Display (21.8k), and Gmail (15.9k).
We created dynamic text replacement to generate a large volume of content-rich landing pages. For example, https://services.pawssum.com.au/emergency-vet?keyword=&loc=sydney is for Sydney, and we only need to change “Melbourne-wide” in the URL to create a new landing page for Melbourne.
→ 9x more hyper-location-specific landing pages for AI to pick from (from 3 service pages to 30)
I worked with the client to set up enhanced conversions for multiple lead stages and map them as Enquiries -> Qualified -> Paying Clients in the same way on Google and their CRM, using UTM parameters to track not only channel effectiveness but also new search-term behaviour.
→ All 55 campaigns are optimised for the most valuable goals with dollar value attached.
Prepare Controls & Safeguards for AI
- Negative keywords: Excluded 100% of branded terms from non-brand campaigns to prevent cannibalisation.
- AI safeguards: Implemented data exclusions for the data outage period and scripts to detect generic queries triggered by AI Max.
- Text controls: Used text customisation guidelines and page exclusions to enforce brand compliance.
- Combined Broad Match + AI Max + negatives + automation within a continuous optimisation loop.
→ Achieved 100% broad match coverage with an 18% conversion rate.
Automation
Used Ad Customisers to dynamically tailor messaging at scale.
100% ads have “Excellent Ad” rating all year round.
Leveraged NanoBanana to streamline creative generation and iteration across campaigns. Expanded production using an asset library + AI,
Tripling creative output and accelerating the testing cycle, helping 100% of Pmax asset groups and 100% of Demand Gen ads have an “Excellent Rating”
Expand with Demand Gen
Three Demand Gen funnels, one per intent stage, matching the message to the moment as owners move from research to booking.
- Top of funnel: educational content on caring for pets and what to do when one falls sick, earning trust early.
- Middle: the Pawssum experience through real client testimonials.
- Bottom: tightly held remarketing with expansion switched off, prompting owners to save our number, because in this category, they call when the need hits.
Key Results
AI Adoption KPI
Optiscore: 90% vs 90.6%
Search
- AI Max adoption: 80% vs 100%
- Excellent Search ad strength rating: 80% vs 100%
- Campaigns with broad match: 80% vs 100%
Pmax
- Excellent asset group strength rating: 70% vs 100%
- Asset groups with Google audience best practice: 100% vs 100%
- Audience match rate of actual paying customers: 90% vs 100%
Business KPIs with support from OMG:
- Increase in daily paying customers (from 60 to 63): 7% vs 12%
- 5 % increase in the invoice per customer to cope with inflation
- At least a 10% increase in overall business revenue.
Conservative Google KPIs
- At least a 10% YoY increase in high-quality leads from 27,000 to 30,000.
- At least 10% YoY decrease in CPL from – At least 10% YoY increase in CVR from
More Case Studies
-

45:1
Ultraceuticals is a leading global skincare brand, well known for its cosmeceutical-grade, scientifically proven products. Led by Dr Heber, Ultraceuticals prioritises environmental sustainability as they constantly strive to look for sustainable skincare solutions that offer optimal results for everyone.

Ultraceuticals
-
186%
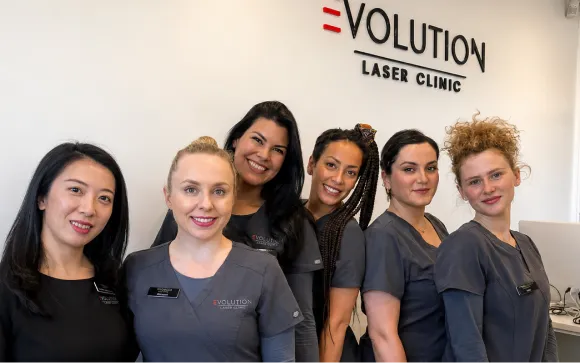
Evolution Laser Clinic has been partnered with OMG since 2019. They wanted us to help them improve their visibility around their key focus terms and grow keyword indexation towards other areas of the business as well. From this, OMG implemented an SEO strategy and PPC to help Evolution Laser Clinic achieve their primary business goal.
Evolution Laser Clinic
-
151%
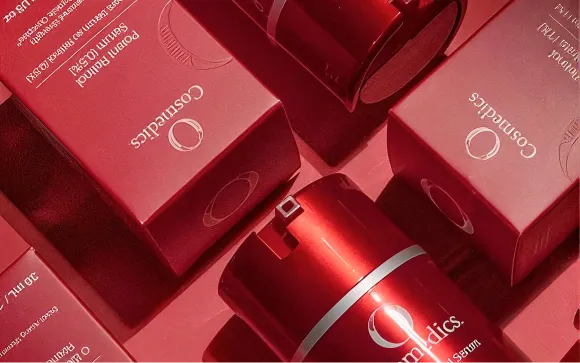
Since partnering with OMG, O Cosmedics has strengthened its digital presence through an integrated digital marketing strategy. By improving site performance, expanding content, and building authority, OMG helped O Cosmedics achieve stronger visibility, traffic, and conversions.
O Cosmedics




Stop Funding Channels You Can’t Measure. Start With the Ones You Can.
Get a PPC audit as part of a digital strategy worth $4,000 at no cost. See what your paid channels are contributing, where budget is being wasted and what to fix, stop or scale first.
No cost. No commitment. Just a clearer next paid-media decision.