


- Home
-

- Blog
-
- Marketing Blogs
-
- Online Digital Marketing Stats You Need to Know
Online Digital Marketing Stats You Need to Know

Comprehensive Guide To Online Digital Marketing Statistics
The online digital marketing world is a constantly evolving field. If you’re not keeping up to date and keep an eye on your online digital marketing stats your campaigns will surely fail.
But how do you know which trends to follow? How can you figure out which techniques generate the returns you’re looking for? Online digital marketing stats probably hold the answer.
We’ve compiled some of the most interesting and important stats for every major aspect of digital marketing, including Search Engine Optimisation (SEO), content and Pay Per Click (PPC) insights.
With these online digital marketing stats by your side, you can make the case for a new campaign or even figure out which strategies to avoid.
Table of Contents
- SEO statistics
- Content marketing statistics
- Social media advertising and marketing statistics
- Video marketing statistics
- Email marketing statistics
- Marketing automation statistics
- Lead generation statistics
- PPC statistics
- Mobile marketing statistics
- more online digital marketing stats
The best SEO statistics
- The result that lands the top position in Google search results has a 34% CTR. (Blue Corona)
- The #1 organic result is 10x more likely to receive a click compared to a page in the tenth spot. (Backlinko)
- Google accounts for 94% of the total organic search traffic that arrives on your website. (Blue Corona)
- SEO has ~20X more traffic opportunities than PPC on both mobile and desktop. (Sparktoro)
- 61% of marketers say improving SEO and growing their organic presence is their top inbound marketing priority. (HubSpot)
- 72% of online marketers describe content marketing as their most effective SEO tactic. (Junto)
- According to Andrey Lipattsev, Search Quality Senior Strategist at Google, high-quality content and link building are the two most important signals used by Google to rank your website for search. (Search Engine Watch)
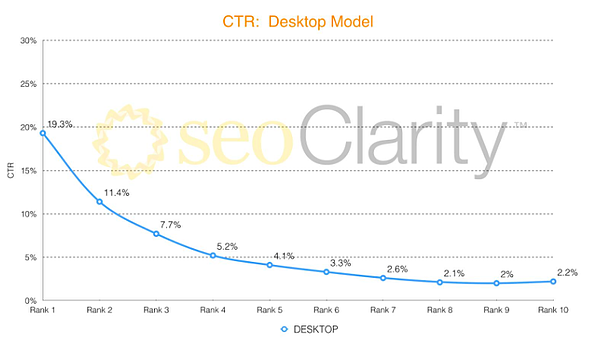
- The first organic desktop listing gets 19.3% of clicks (SEOClarity)
 (Image Source: SEOClarity)
 - There are 6,586,013,574 searches made a day worldwide. (SmartInsights)
- Organic search equates to 95% of all web traffic. (SimilarWeb)
- Leads from search engines have a 14.6% close rate, while outbound leads have a 1.7% close rate. (Junto)
- 70-80% of people ignore paid search results, choosing to only click on organic search results. (Junto)
- 75% of people never scroll past the first page of search engines. (Junto)
- 72% of people who conduct a local search will eventually visit a physical store as a result of that search. (Junto)
- If your page doesn’t load within two seconds, half of your traffic will bounce away to other websites. (Junto)
- 78% of local searches lead to a purchase being made offline. (Junto)
- Google processes over 100 billion searches every single month. (Google)
- You can double your organic search traffic if your search result has a video thumbnail. (Econsultancy)
- About 40% of the search results that reach Google’s first page are in https format. This is important because 82% of people will stop a purchase if they notice a website isn’t secure. (Blue Corona)
 (Image Source: SEOClarity)
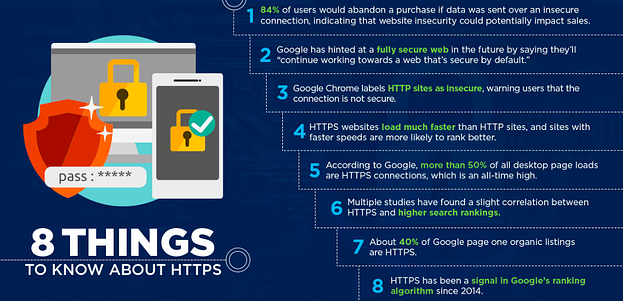
(Image Source: Blue Corona)
The best content marketing statistics
- Blogging is the third most common content marketing strategy, after video and eBooks (HubSpot).
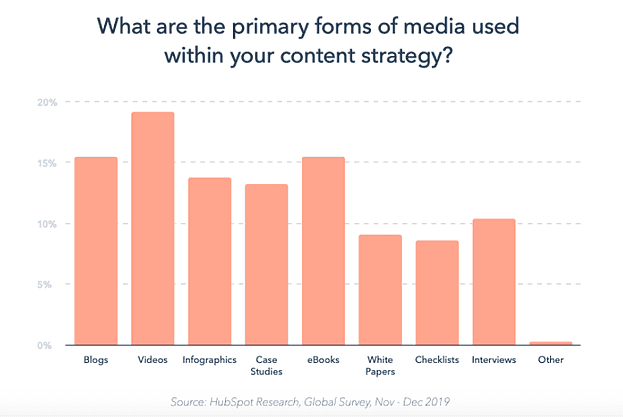
(Image Source: HubSpot)
- Adding a blog to your website can increase its chances of ranking in search engines by 434%. (Blue Corona)
- Improvements in content quality have been known to increase blog traffic as much as 2000%. (Search Engine People)
- There are over 600 million active blogs globally in 2020. (Growth Badger)
- The average length of Google’s top-ranking pages is 1890 words. (Search Engine People)
- Companies with blogs produce an average of 67% more leads monthly than companies that don’t blog. (DemandMetric)
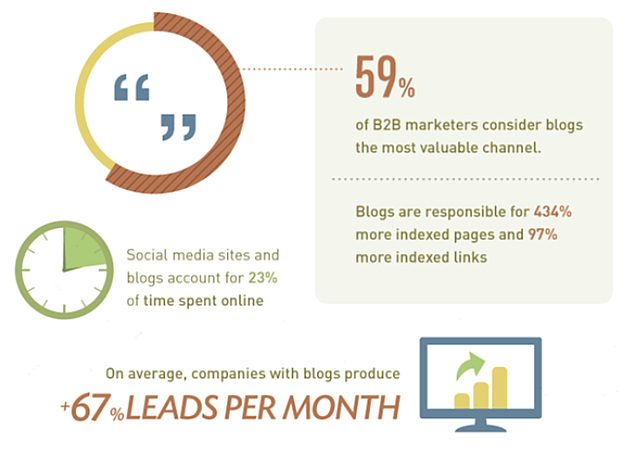
(Source: DemandMetric)
- Marketers who prioritise blogging are 13 times more likely to experience positive ROI (Hubspot).
- 70% of people would rather learn about a company through articles rather than advertisements. (DemandMetric)
- Content marketing leaders experience year-on-year traffic growth of 19.7%. Content marketing followers only achieve growth of 2.5%. (Upland)
- Globally, 41% of marketers confirm inbound produces measurable ROI, and 82% of marketers who blog achieve a positive ROI through their inbound marketing efforts. (Invespcro)
- Organisations that post at least 16 blog posts per month receive 3.5 times more traffic than those that publish between 0 and 4. They also receive 4.5% as many leads. (Marketing Insider Group)
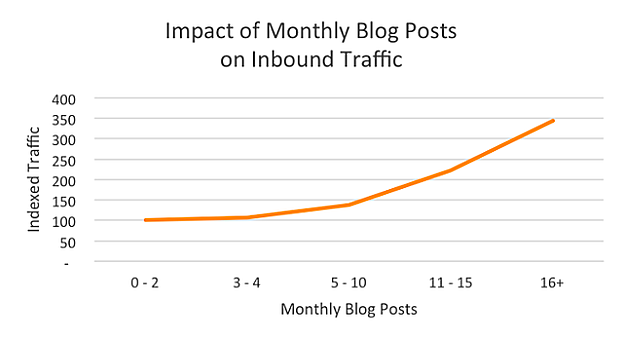
(Image Source: Marketing Insider Group)
- Content marketing achieves three times the number of leads as paid search campaigns. (Neil Patel)
- 55% of B2B marketing professionals don’t understand what content marketing success actually entails. (Uhuru Network)
- Content marketing produces three times as many leads as traditional strategies while costing 62% less. (Content Marketing Institute)
- The average cost per leads drops 80% after five months of consistent inbound marketing. (Invespcro)
- Content from industry leaders and influencers receive more credence from B2B buyers in 87% of cases. (Content Preferences Report)
- 95% of potential purchasers will exchange personal information for a valuable whitepaper. (Internal Results)
- Content marketers achieve conversion rates of 2.9%. This drops to 0.5% for organisations that don’t use content marketing. (Aberdeen Group)
- 47% of people read between three and five pieces of content before arranging a conversation with a sales rep. (Demand Gen Report)
- 86% of organisations classed as “highly efficient” have somebody in charge of their content marketing strategy. (Content Marketing Institute)
Hire The #1 Content Marketing Agency in Australia |
The best social media marketing statistics
Hire The #1 Social Media Advertising Agency in Australia
Facebook social media online marketing stats
- As of Q1 2020, there are 2.6 billion monthly active Facebook users. (Statista)
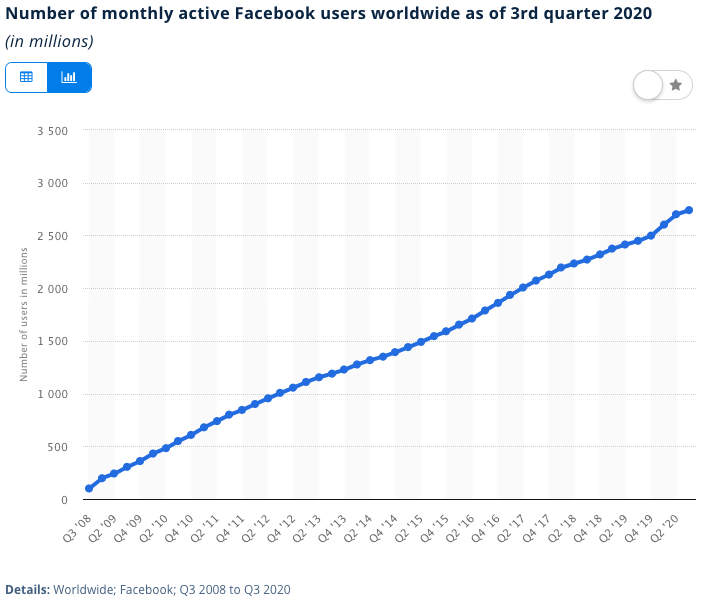
(Image Source: Statista)
- Facebook is the primary content distribution channel for marketers today. (HubSpot)
- Facebook is the third most-visited website outranked only by Google and YouTube. (Zephoria)
- Nearly 75% of high income earners use Facebook. (Zephoria)
- 61% of all visits from social media websites come from Facebook. (Search Engine People)
- More than two billion searches are performed on Facebook daily. (Search Engine People)
- There are more than 50 million small businesses using Facebook to connect with customers. (DreamGrow)
- There are over 80 million small businesses using Facebook’s free business tools. (HubSpot)
- 18% of marketers currently use Facebook Groups. (HubSpot)
- The number of marketers who say Facebook is critical to their business has increased 83% in just two years. (WPForms)
- 64% of all online shoppers claim that videos that they saw on social media platforms like Facebook influenced a purchasing decision. (Social Media Today)
- A Facebook post that includes an image engages 2.3 times more people than one without. (HubSpot)
- 79% of video marketers use Facebook as a video marketing channel. (Wyzowl)
- In April 2020, over 98% of Facebook’s active user accounts worldwide accessed the social network via mobile phone. (Statista)
Hire The Best Facebook Ads Agency in Australia
LinkedIn online digital marketing stats
- LinkedIn has 675 million monthly users, a 14% increase since the end of 2018. (Hootsuite)
- As of October 2020, LinkedIn’s number of users in the US reached 170 million, making it the country with the most users in the world. (Statista)
- 94% of B2B marketers use LinkedIn for content marketing. (Hootsuite)
- 89% of B2B marketers use LinkedIn for lead generation. (Hootsuite)
- Cost per lead on LinkedIn is 28% lower than Google AdWords. (Hootsuite)
- 66% of B2B marketers claim LinkedIn is the most valuable social media platform for their efforts. (LinkedIn)
Hire the Top Rated LinkedIn Advertising Agency in Australia
Pinterest online digital marketing stats
- 28% of all marketers worldwide use Pinterest to market (Statista).
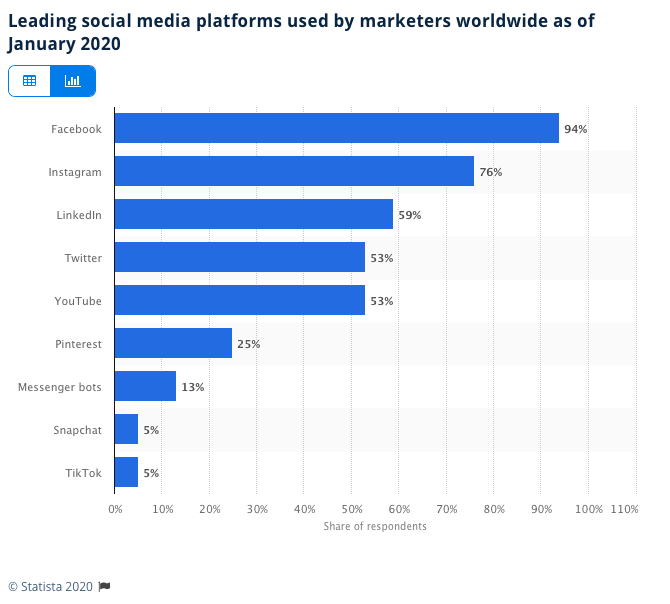
(Image Source: Statista)
- Pinterest currently has 322 million monthly active users. (Pinterest)
- More than two billion test-based and guided searches are carried out on Pinterest every month. (Pinterest)
- Seven out of every ten Pinterest users are female. (eMarketer)
- 97% of queries carried out on Pinterest are unbranded. (Pinterest)
- One-third of Pinterest users in the US say they use the social media platform to follow brands and companies. (Statista)
- 77% of pinners say they have discovered a new brand or product while browsing on Pinterest. (Pinterest)
- 82% of Pinterest users have bought products based on their brands’ content on Pinterest. (Pinterest)
Instagram online digital marketing statistics
- One billion people use Instagram every month. (Hootsuite)
- 500 million people use Instagram Stories every day. (Hootsuite)
- Instagram is the social channel with the second-highest ROI among marketers. (HubSpot)
- 28% of video marketers plan to include Instagram TV in their 2020 video marketing strategy. (Wyzowl)
- In 2023, Instagram is projected to reach 120.3 million monthly active users in the US, up from 107.2 million users in 2019. (Statista)
- In 2019, there were 4.95 million brand-sponsored influencer posts on the social platform. (Statista)
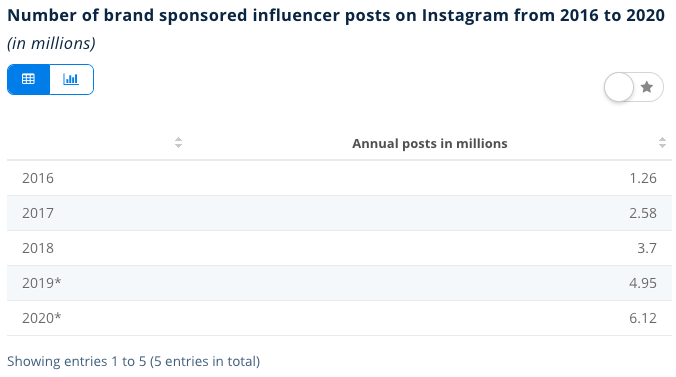
(Image Source: Statista)
- 63% of Instagram users log in at least once per day. (Hootsuite)
- 200 million Instagram users visit at least once business profile daily. (Hootsuite)
- One-third of the most viewed Instagram Stories are from businesses. (Hootsuite)
- Instagram’s potential advertising reach is 849.3 million users. (Hootsuite)
Hire The Top Rated Instagram Advertising Agency in Australia
Twitter online digital marketing statistics
- The number of global daily active users on Twitter is 187 million. (Statista)
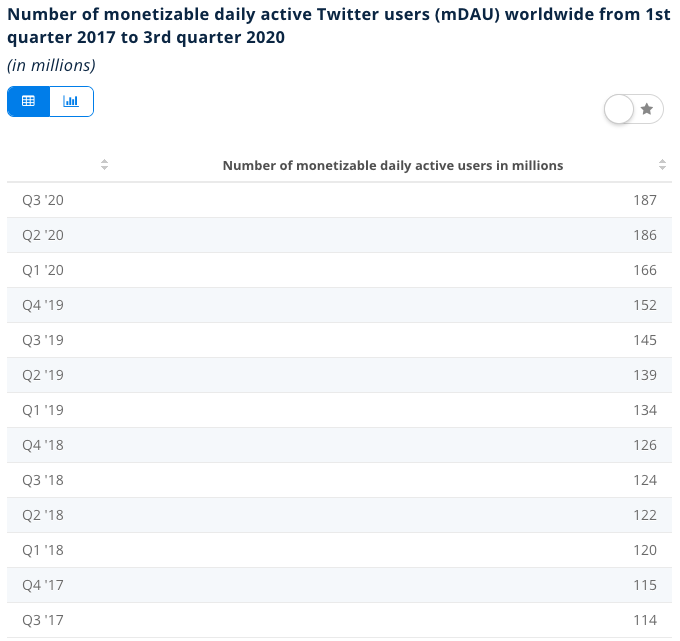
(Image Source: Statista)
- The number of global daily active users on Twitter is 187 million. (Statista)
- Twitter is among the top three social channels used by marketers with the highest ROI. (HubSpot)
- Twitter generated 87% of its revenue through advertising services in 2019. (Statista)
- 38% of video marketers plan to include Twitter in their 2020 video marketing strategy. (Wyzowl)
The best video marketing statistics
- Video is the second most-used content type on social media used to increase audience engagement. (HubSpot)
- Companies that take advantage of video marketing increase revenue 49% faster than those that don’t. (Infographic World)
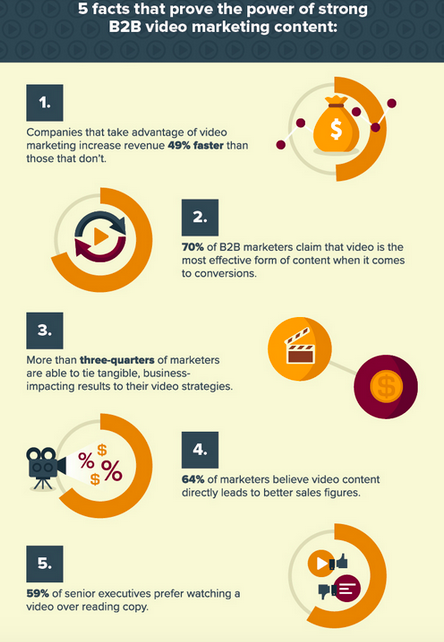
(Infographic Source: Infographic World)
- 70% of B2B marketers claim that video is the most effective form of content when it comes to conversions. (Infographic World)
- Online videos make up more than 80% of all consumer internet traffic. (Omnikick)
- Including video on landing pages can increase conversion rates by 80%. (Omnikick)
- Video ads achieve an average CTR of 1.84%. This is higher than any other form of display advertising. (Business Insider)
- 85% of businesses use video as a marketing tool. (Wyzowl)
- 92% of marketers who use video say that it’s an important part of their marketing strategy. (Wyzowl)
- 83% of video marketers say video has helped them generate leads. (Wyzowl)
- 87% of video marketers say video has increased traffic to their website, and 81% of marketers say video has increased the average time their visitors spend on page. (Wyzowl)
- Facebook generates an average of 8 billion video views per day. (Kinsta)
- When compared to plain text, video is 50% more likely to achieve strong organic search rankings. (SEO Inc)
- Blogs that contain videos see an average of 157% more traffic than blogs that don’t contain videos. (LinkedIn)
- A shopper who watches a video is nearly two times more likely to convert than a shopper who doesn’t. (The Good)
YouTube marketing statistics
- As of 2020, YouTube is the most-visited website in the world. (Ahrefs)
- Users view more than one billion hours of video each day on YouTube. (YouTube)
- YouTube now reaches more people aged 18 and over than cable television during primetime hours. And that’s on mobile devices alone. (Think with Google)
- In the US alone, YouTube will make $5.5 billion in advertising revenue in 2020. (Statista)
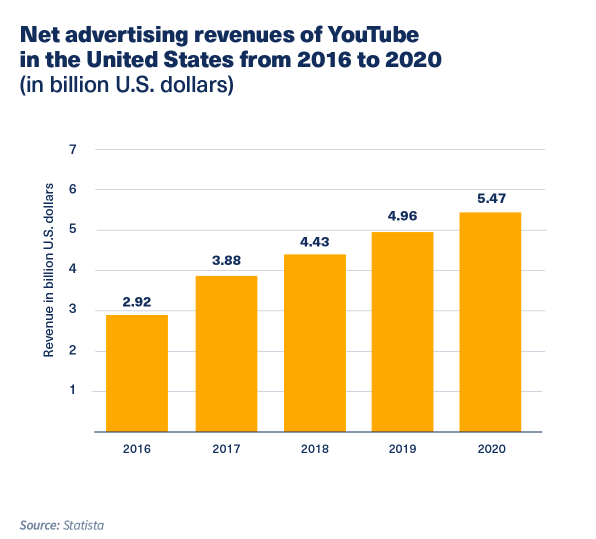
(Image Source: Statista)
- YouTube remains the most widely used platform for video marketers, with 85% of video marketers having used it in 2019. (Wyzowl)
- 83% of video marketers that have used YouTube said it had been successful for them. (Wyzowl)
Hire the #1 YouTube Advertising Agency in Australia
TikTok marketing statistics
- TikTok has 800 million active users worldwide. (MarkinBlog)
- More than one billion videos are viewed on TikTok each day. (MarkinBlog)
- So far, TikTok is the number one downloaded app of 2020. (Hootsuite)
- TikTok ranks sixth among apps for consumer spending worldwide. (Hootsuite)
- TikTok guarantees five million daily impressions for brand takeover ads. (Hootsuite)
The best email marketing statistics
- The number of global email users is set to grow to 4.48 billion users by 2024. (Statista)
- 49% of marketers consider email marketing an important lead generation tactic, while 47% consider it important for lead nurturing. (Influencer Marketing Hub)
- The best time to send an email to maximize open rates and CTR is before and after daytime working hours. (Super Office)
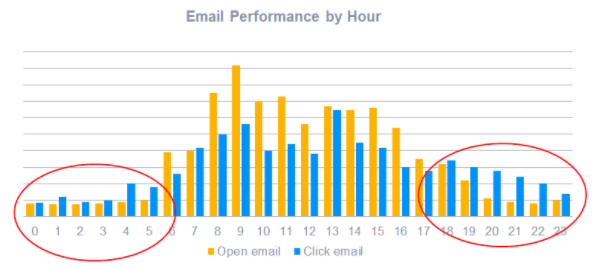
(Image Source: Super Office)
- Message personalization is the number one tactic used by email marketers to improve performance. (HubSpot)
- 35% of marketers send three to five emails per week to their customers. (HubSpot)
- Email campaigns achieve on average a 17% open rate and a 4% CTR. (HubSpot)
- Promotional emails are the most common email type that marketers are investing in. (HubSpot)
- Email marketing was ranked as the second most effective medium for building brand awareness for small businesses. (Campaign Monitor)
- Email marketing has the highest return on investment for small businesses. (Campaign Monitor)
- Tuesdays and Wednesdays are the best days to send an email if you want the best chance of it getting opened. (Optinmonster)
- 40.5% of people who receive an email after abandoning a shopping cart will open the email. (Media Buzz)
- Segmented email campaigns achieve almost 15% higher open rates than non-segmented campaigns. Segmented campaigns also achieve almost 75% more clicks. (Backlinko)
- Segmented campaigns see as high as a 760% increase in revenue. (Campaign Monitor)
- Video-based emails achieve a 96% higher CTR than emails that don’t contain video. (Mar Tech Advisor)
- Placing the recipient’s first name in an email’s subject line leads to a higher CTR. (HubSpot)
- Email marketing generates a return of $38 for every dollar spent. (HubSpot)
The best marketing automation statistics
- 68% of businesses use automation in some way. (HubSpot)
- Most B2B marketers say the ability to generate more high quality leads is the number one benefit of marketing automation. (Liana Technologies)
- 98% of people believe that marketing automation will play a critical role in their future business success. (Liana Technologies)
- Marketers who rely on automation generate twice the number of leads that marketers who use blast emails. Respondents also believe them to be twice as effective when communicating. (Autopilot)
- 91% of marketing automation users think it’s very important to their overall online marketing efforts. (Sherpa)
- Almost two-thirds of marketers claim to have seen the benefit of marketing automation within half a year of its implementation in their organisations. (Salesfusion)
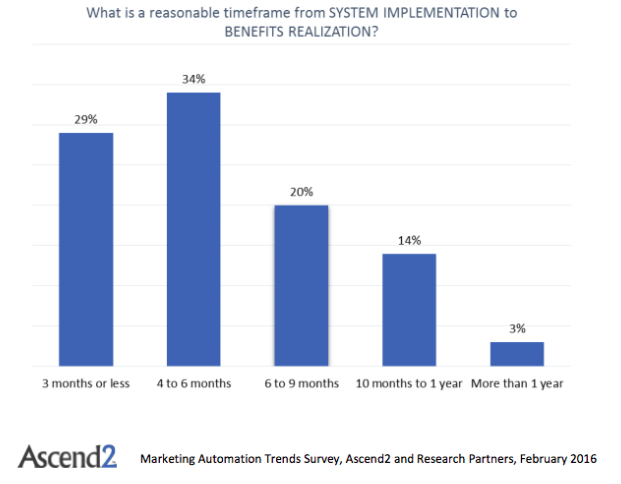
(Image Source: (Salesfusion)
- Email automation campaigns are among the top three tactics used by email marketers to improve performance. (HubSpot)
- Anticipated year-over-year growth for marketing automation platforms is 31%. (Salesforce)
- Nearly 70% of marketers report that the most important benefit of automation technology is the improved targeting of messages. (Liana Technologies)
The best lead generation statistics
- On average, organizations generate 1877 leads per month and 1523 MQLs. (HubSpot)
- The top priority for marketers is generating leads. (HubSpot)
- However, 61% of marketers rank lead generation as their number one challenge. (HubSpot)
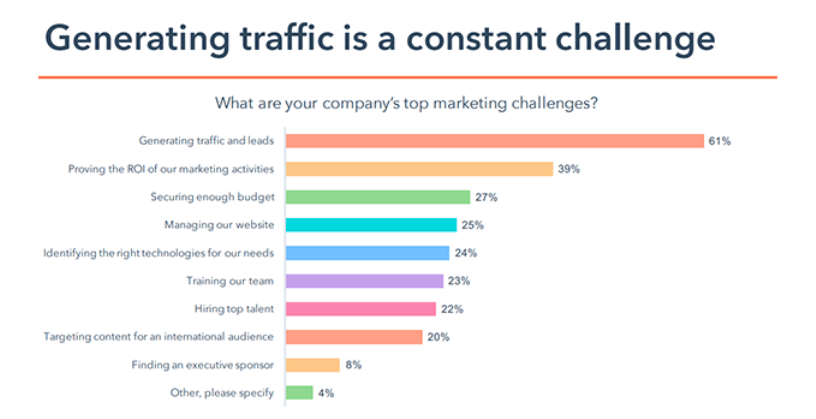
(Image Source: Funnel Overload)
- 53% of marketers spend at least half of their budget on lead generation. (Funnel Overload)
- Leads are 9x more likely to convert when businesses follow-up within 5 minutes. (Funnel Overload)
- Ad placement and audience targeting are the top ways that advertisers drive more demand. (HubSpot)
- Outsourcing lead generation generates 43% better results than in-house lead generation. (Fearless Competitor)
- 80% of marketers think marketing automation generates more leads and conversions. (APSIS)
- 49% of companies report that increasing customer acquisition is their primary objective. (HubSpot)
- Over 60% of marketers said that their customer acquisition cost has increased in the past three years. (HubSpot)
Hire Australia’s Best Lead Generation Agency
The best Pay-Per-Click (PPC) digital marketing Stats
- Across all industries, the average cost-per-click (CPC) on Google Ads is $1 to $2 for the Google Search Network and less than $1 for the Google Display Network. (Web FX)
- Paid ads have an 11.38% CTR on Google. (SparkToro)
- 79% of marketers say PPC is hugely beneficial for their business. (PPC Protect)
- A shocking 60% of people can’t tell the difference between Google ads and organic search results. (Marketing Tech)
- 64.6% of searchers click on Google Ads when they’re specifically looking to buy a product online. (Wordstream)
- The average business earns $2 for every $1 that they spend on Google AdWords. (Wordstream)
- On average, 41% of clicks go to the top 3 paid ads on the search results page. (Wordstream)
- Google’s display network ad campaigns reach 90% of internet users across the globe. (Google)
- Display advertising has proven to increase traffic to websites by 300%. (Visually)
- Three-fourths of people (75%) say paid search ads make it easier to find the information they are searching for on a website or search engine. One-third of people (33%) click on a paid search ad because it directly answers their search query. (Search Engine Land)
- Search ads can increase brand awareness by 80%. (Google)
- 63% of people said they’d click on a Google ad. (Search Engine Land)
- PPC visitors are 50% more likely to purchase something than organic visitors. (Unbounce)
Hire the #1 PPC Agency in Australia | Hire The #1 Google Ads Management Agency in Australia | #1 Google Remarketing & Retargeting Agency in Australia | Hire The Best Microsoft Ads Agency in Australia | Hire The #1 Google Shopping Ads Agency in Australia | Hire The #1 Custom Landing Page Design Agency in Australia
The best mobile digital marketing stats
- Mobile devices now drive over 52% of web traffic and account for nearly two out of every three minutes online. (Blue Corona)
- The average person spends 70% of their digital media time on a mobile device. (Marketing Land)
- The first organic mobile listing gets 27.7% of clicks (SEOClarity).
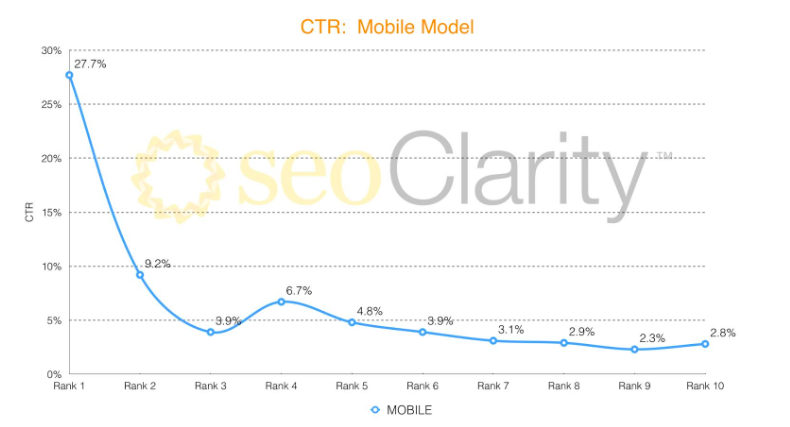
(Image Source: SEOClarity)
- Average CTR for mobile PPC ads drops by 45% between the first and second-placed ads. (Wordstream)
- When shopping online, 84% of people between the ages of 19 and 29 will use a mobile device. (PR Newswire)
- 57% of people will tell others to avoid a website that offers a poor mobile experience. (Sweor)
- Over 50% of those surveyed say they’ve discovered a new company while using Google to search on a mobile device. (Think with Google)
- About 30% of mobile searchers are looking specifically for a local business. (Search Engine Land)
- In 18% of cases, local searches on mobile devices lead to a sale being made the very same day. (Business 2 Community)
- In 2019, mobile advertising spending was $190 billion worldwide. (Statista)
- Mobile advertising spending is expected to surpass $280 billion by 2022. (Statista)
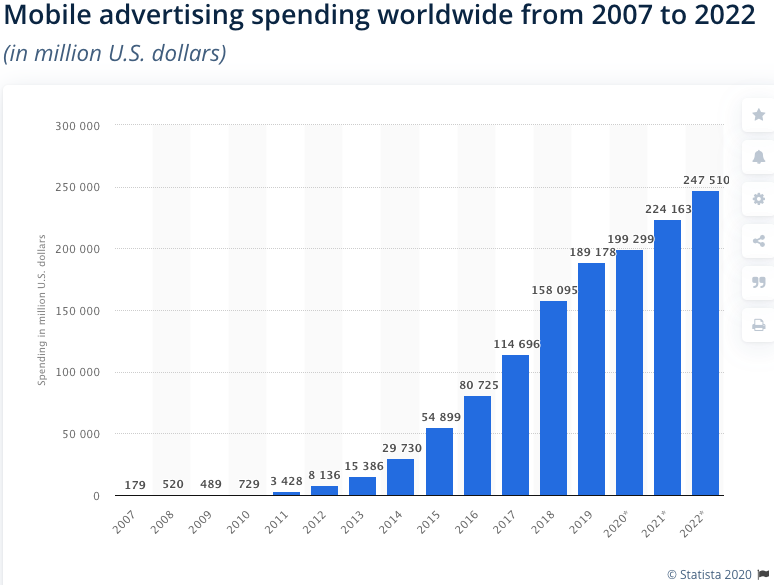
(Image Source: Statista)
- Mobile sites that load up in less than five seconds engage users for 70% more time than those that take longer than 5 seconds. (Think with Google)
- Android users spend an average of $89 per order made using their mobile devices. This increases to $114 for Apple users. (Omnicore)
Even More Online Digital Marketing Stats You Need To Know
Where consumers go, advertisers follow. That is the essence of SEM / Search Engine Marketing. So many businesses are reaping the rewards of online advertising. How can you do the same? These online advertising statistics provide the magic key.
Use these insightful online advertising statistics to inform your digital marketing strategy.
Already got your pay per click or social media advertising strategy ready to go? These stats could be just what you need to win over the boss and score more budget.
To help you navigate the numbers, we’ve grouped the statistics into a few handy categories. Skip to the areas that you need, or simply devour them all.
Online advertising investment statistics
How much are marketers and advertisers investing in online advertising? Where is it increasing? And most importantly, how does your investment compare?
- Digital spending will grow 2.4% worldwide in 2020, the first time on record that growth has been in single digits. The $332.84 billion total for 2020 (shown in the graph below) represents $36.11 billion less spending than eMarketer’s pre-pandemic forecast.
 Image Source: eMarketer
 - For contrast, in 2019, global digital ad spend rose by 17.6% to $333.25 billion, accounting for roughly half of the global ad market.
 Image Source: eMarketer
 - Digital display advertising spending in the United States amounted to $35.24 billion US dollars and is expected to reach $52.76 billion by the end of 2020. While the Coronavirus pandemic has affected digital ad spending globally and many industries have experienced a decline, some industries are still producing relatively standout increases in ad spending.
 Image Source: eMarketer
 - At least 70% of media buyers still have “2021 ad dollars in flux.” Buyers that are looking ahead predict a 5.3% uptick for 2021 compared to 2020. In short, the pandemic has impacted advertising budgets, but digital advertising is still considered essential for most brands and retailers. Digital advertising offers brands the opportunity to get in front of their target audience at exactly the right time. With COVID-19 accelerating digital adoption for brands and consumers, optimised digital marketing strategies have the potential to overtake traditional advertising and dominate the advertising landscape in the near future.
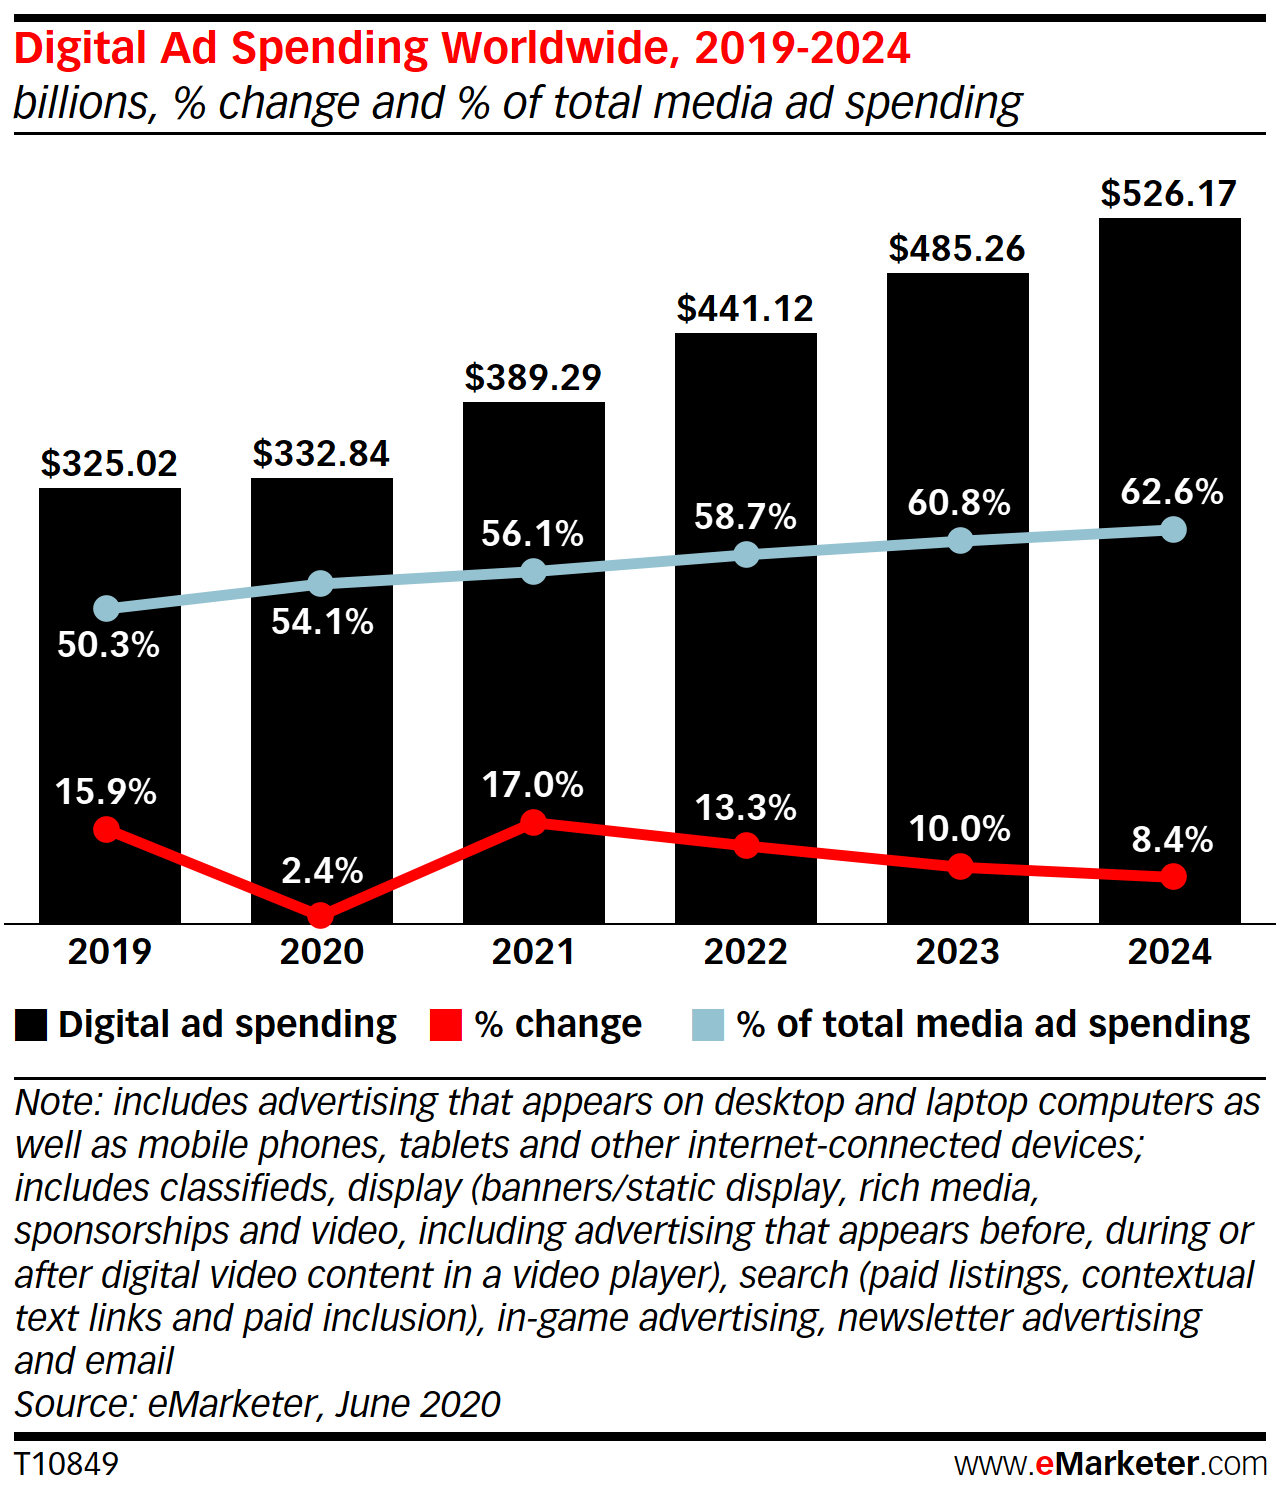 Image Source: eMarketer
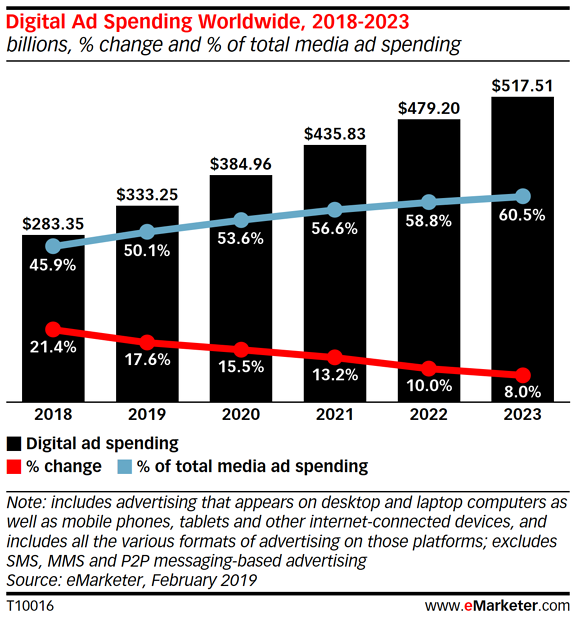 Image Source: eMarketer
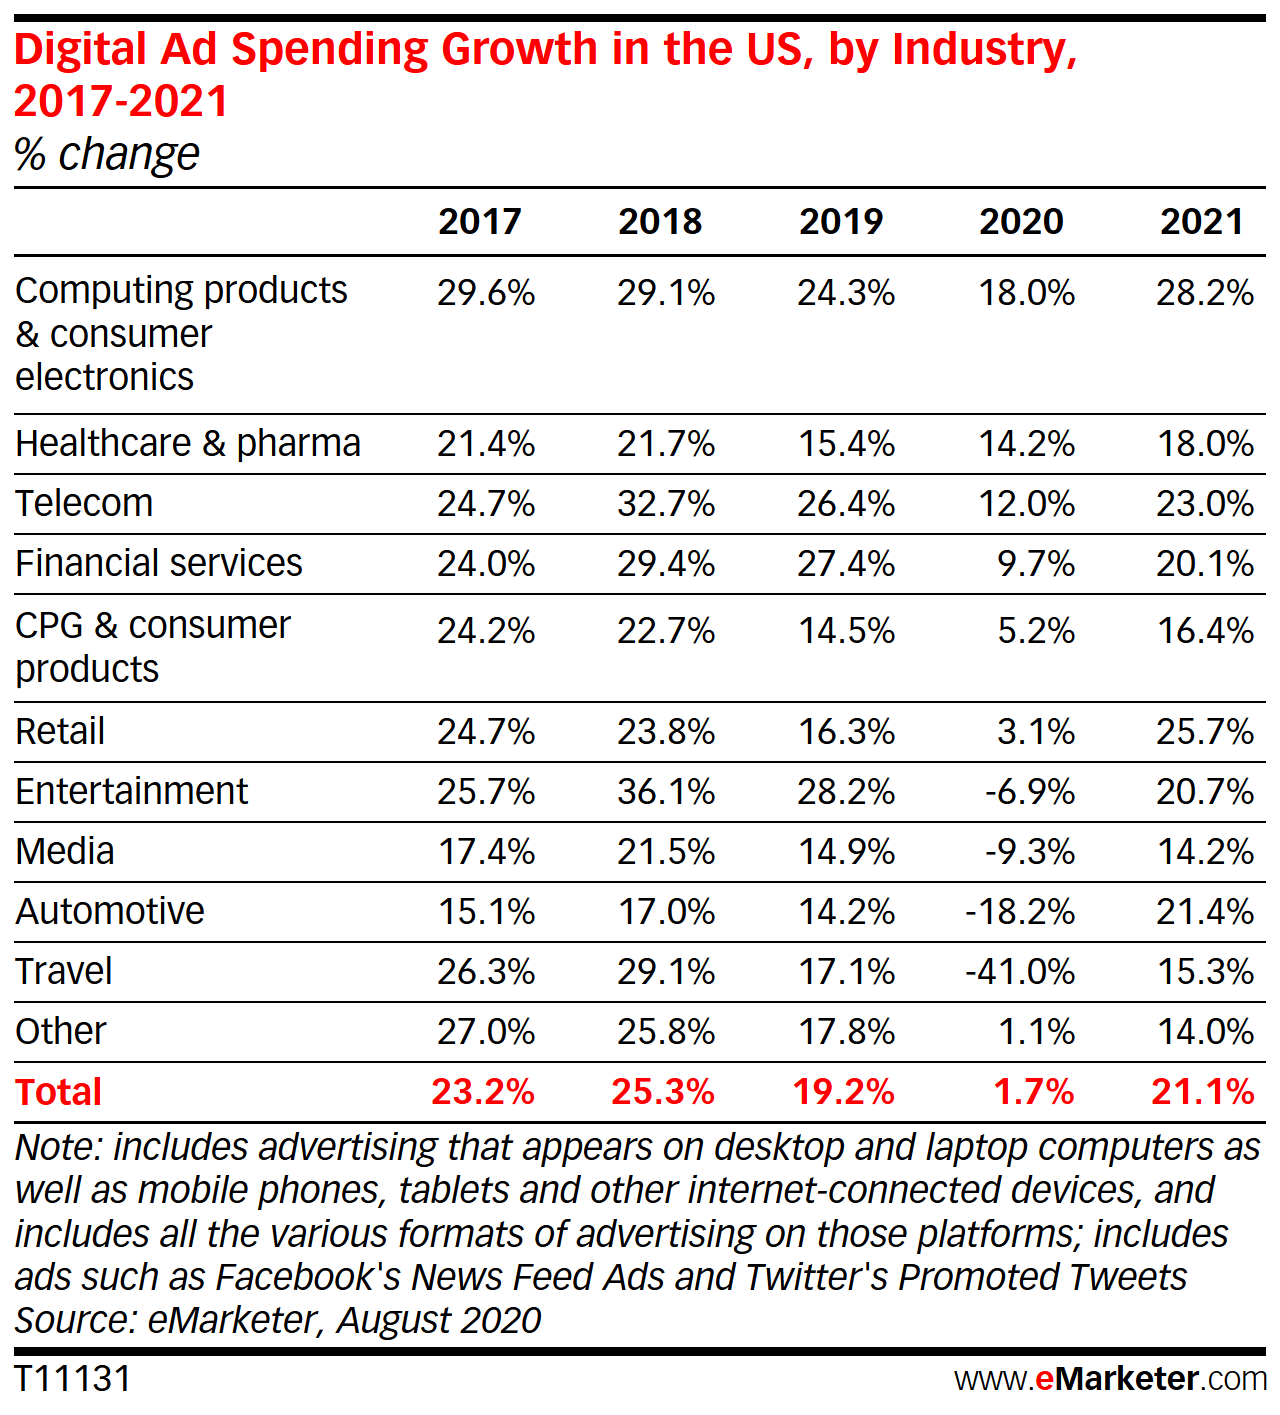 Image Source: eMarketer
Online digital marketing advertising ROI statistics
Need to sell in your strategy to the powers that be? These ROI based online advertising statistics will you help build a winning business case.
- Omnichannel strategies drive an 80% higher rate of incremental store visits for local businesses.
- Over 70% of digital marketers fail to target consumers with behavioral data.
- 88% of digital display ad dollars in the US are forecasted to be exchanged programmatically by 2021. Advertisers are predicted to spend $98 billion on programmatic advertising in 2020 alone, which will make up 68% of their total annual digital media advertising spend.
- Programmatic ad revenues now account for 80% of all digital display advertising revenues in the United States with companies benefitting from its cost efficiencies.
- Mobile internet advertising revenues are growing year-on-year, standing at 39.7% in 2018.
- One company generated 500% growth in return on ad spend (ROAS) and a 200% drop in cost per click (CPC) for paid advertising.
- Another company achieved 256% more clicks and 70% lower cost per click using PPC, resulting in attracting more clients who were looking for their products.
Google Ads PPC online ad statistics
Google AdWords Advertising has been around for nearly two decades. So, how powerful is the platform really? Does it still hold the crown for paid ads?
Let’s dive in…
- Google’s net US digital ad revenue is estimated to generate $39.58 billion in 2020, a decline of 5.3% from $41.80 billion in 2019. This marks the first time Google will have an annual decline in ad dollars, bringing Google’s share of the US digital ad market to 29.4%, down from 31.6%.
- Businesses make an average of $2 in revenue for every $1 they spend on Google Ads.
- Across all industries, the average cost per click (CPC) in Google Ads is $2.69 on the Search Network and $0.63 on the Google Display Network.
- The average click-through rate (CTR) in Google Ads is 3.17% for the search network and 0.46% on the display network. Hint: Nail your ROI with these Adwords bidding strategies.
- Gmail ads with an open rate around 2% have a CPC of around $1 USD. That number drops to less than 20 US cents for ads with an open rate above 25%.
Advertising platform statistics
Investing in Google Ads is a great way to get your business in front of more people. But, Google Ads is not the only player out there – so which other online advertising and digital media platforms should you be looking at?
YouTube
- YouTube’s worldwide advertising revenues amounted to 5.04 billion U.S. dollars in the third quarter of 2020, representing a 32 percent year-over-year increase.
- YouTube overall represents a steady 11% of Google’s net US ad revenues.
- Paid YouTube mobile advertising is 84% more likely to receive attention than advertising on TV.
- Nearly 79% of marketers think YouTube is the most effective platform for video marketing.
- 43% of new customers buy something they saw in a YouTube ad.
Amazon
- Amazon is predicted to increase its US ad revenue to 13 billion this year, growing 23.5% when compared to 2019.
Social media advertising online digital marketing stats
Social media can play a big role in the purchase journey right up to the point of purchase, but what role do ads play in this journey? And what social media platforms are worth your time and budget? Should you be creating Instagram ads, YouTube ads, Facebook ads – or all three?
Take a look at the following social media advertising statistics.
- 3.96 billion people use social media today, which accounts for roughly half (51%) of the global population.
- On average, digital consumers worldwide spend an average of 144 minutes a day on social networks and messaging.
- 72% of internet users say they find new products and brands through paid social ads.
- Facebook is the world’s third most-visited website, outranked only by Google and YouTube.
- An average Facebook user clicks on 11 ads per month, and 94% of Facebook’s revenue comes from mobile advertising.
- Facebook also accounts for 80.4% of US social referral share to ecommerce sites, and earns 40% of annual digital display revenue.
- According to a Bloomberg Intelligence report, Instagram was worth $100 billion by 2018.
- As of January 2020, there are nearly 1 billion monthly active users on Instagram.
- It is estimated that Instagram brought in $2 billion in ad revenue in Q2 2018. Studies anticipate this rising to as much as $7 billion by Q3 2020.
- Instagram ad revenue as a share of Facebook ad revenue is projected to rise from 9% in 2017 to 30% in 2020.
- 1 in 3 Instagram users have made a purchase after discovering a new product or service on Instagram.
- Around 75% of Instagram users are expected to take action on at least one ad at some point.
- Pinterest’s active user base grew 26% to 335 million last year, with revenue topping $1 billion. Pinterest attributes its growth to an increase in demand from new advertisers and advances in its conversion optimisation products.
- Advertisers can reach more than 169 million people on Pinterest.
- People on Pinterest are more than 2X as likely to say Pinterest ads feel more personalised than ads on other platforms. (Pinterest)
- 42% of WhatsApp users agree they tend to buy brands they see advertising, however 26% say they use an ad blocker because most ads are annoying and irrelevant.
Mobile Online Digital Marketing Stats
You know about the growing importance of mobile and mobile advertising to engage your target audience, but what are the key mobile online advertising statistics every marketer should know?
- Digital advertising revenue in the United States grew by 15.9% in 2019 compared to 2018, from 107 billion to 124 billion U.S. dollars. A year earlier was the first time the figure surpassed 100 billion dollars, owing to the increase in mobile advertising and the emergence of new channels and media formats.
- Mobile internet advertising revenues reached $86.7 billion in 2019 which represented a 24% increase over 2018 revenues of $69.9 billion.
- Showing up in mobile search ad results can increase brand awareness by 46%.
- Is your brand showing up on mobile devices? Appearing in mobile search ad results can increase brand awareness by 46%.
- Two-thirds of consumers can recall a specific brand they’ve seen advertised on mobile in the past week, and 20% make weekly purchases based off digital ads.
- Ever wondered how long it takes to form an emotional connection? It takes the human brain less than a half-second to engage with mobile advertising and trigger an imprint, positive or negative.
Online advertising channels
Search ads, display ads, programmatic, AR, native – with so many different online advertising formats and types out there, it’s tough to know where to invest your budget.
These online advertising statistics provide insights into the latest advertising trends.
- A tiny 8% of users account for 85% of clicks on display ads.
- Consumers view native ads over 50% more than banner ads, because they don’t “feel” like traditional ads.
- Native ads are driving engagement: they registered an 18% higher lift in purchase intent and 9% lift in brand affinity responses compared to banner ads.
- The average conversion rate for all pop-up ads is 3.09%.
- Augmented Reality (AR) ads boast conversion rates in the 20–80% range, with a number of major brands like Nike, Gucci, Ariana Grande, and Sephora growing their audience base and building brand loyalty through AR ads.
- In 2019, advertisers in the United States spent nearly $60 million on programmatic digital display advertising. By 2024, expenditures are expected to increase to nearly $95 million.
- 60% of consumers said they’ve looked up a product or service after hearing an ad during a podcast, and 25% have purchased a product they discovered through a podcast ad.
Video advertising statistics
Research by Global Web Index shows that using social video as a marketing strategy appears less intrusive than ads and allows brands more opportunities in communicating their message and building engagement.
So, which video ads work and why?
- Video has outperformed all other formats across desktop and mobile, with revenues growing 6.6% and 65% year-on-year respectively.
- In 2016, Wyzowl found that 61% of businesses were using video as a marketing tool. That rose to 63% in 2018, 81% in 2018, and 87% in 2019. and to 87% in 2019.
- 92% of marketers who use video say that it’s an important part of their marketing strategy.
- 89% of marketers say that video gives them a good ROI.
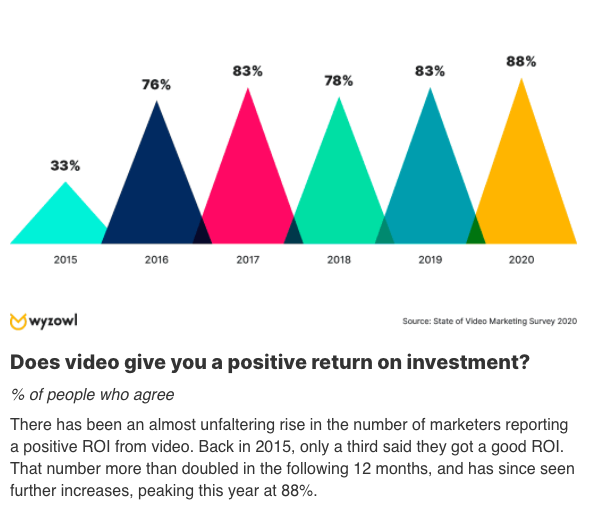
Image Source: Wyzowl
- 48% of marketers create 4+ videos every month.
- Mobile video consumption rises by 100% every year.
- More than 1 in 3 social video viewers have watched videos made by brands on any device online in the past month.
- Social video viewers have an above average likelihood for clicking on sponsored posts on social networks or sharing posts from a brand.
- Customers want video! 96% of people have watched an explainer video to learn more about a product or service.
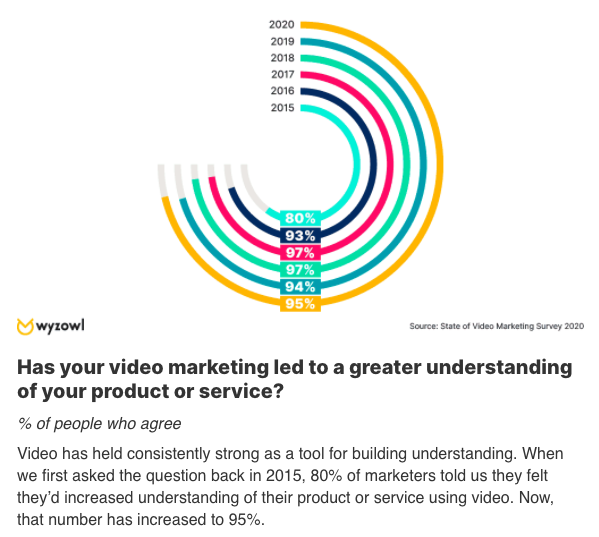
Image Source: Wyzowl
- Nearly 75% of respondents cited viewability and brand lift as the metrics that would most influence their online video advertising tactics.
- When it comes to completion rates, “mid-roll” video ads placed in the middle of a video scored the highest at 97%, followed by “pre-roll” ads (74%) and “post-roll” ads (just 45%).
- What video length works best? 20-second ads have the lowest completion rate of 60%, with 15-second and 30-second ads scoring much higher at 84% and 90% respectively.
- Viewers who watch TrueView ad to completion or for at least 30 seconds were 23 X more likely to visit or subscribe to a brand channel, watch more by that brand, or share their video.
- Audio or no audio? A massive 81% of consumers turn the sound OFF video ads.
- 95% of YouTube ads are audible, compared to 15% of Facebook video ads. Google cites an improvement in brand awareness, ad recall, and consideration for audible and viewable ads:
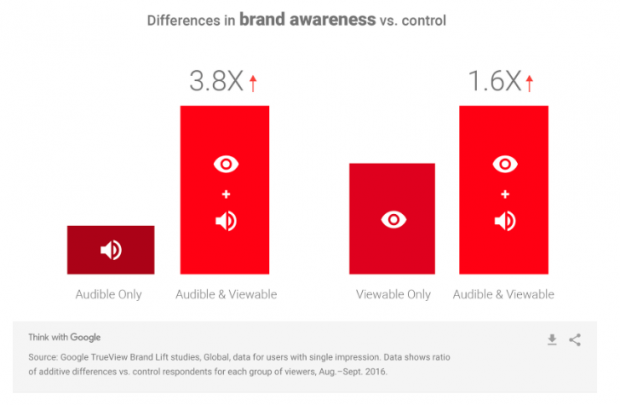
Image Source: Google
- By 2021, video advertising is predicted to grow into a $22 billion industry.
- By 2024, online videos will make up more than 82% of all consumer internet traffic – 15 times higher than it was in 2017.
Audience behaviour statistics
What will hold back the success of your online advertising strategies? Not knowing your audience.
Take a look at the top user behaviour trends here.
- 40% of internet users globally use an ad-blocker today, with APAC leading the way.
- 48% of ad blockers report “too many ads” as their main reason for blocking ads, with 47% saying the ads are “annoying or irrelevant” and 44% saying the ads are “too intrusive”.
- 82% of smartphone users consult their phones while in a store.
- 73% of consumers say they dislike pop-up ads.
- 49% of people say they click on text ads, compared to 31% for Shopping ads and 16% on video ads.
- 70% of consumers prefer to learn about products through content rather than through interruption-based advertising, which is why native advertising is a powerful option.
The Rise of Online Advertising in Australia: Key Stats and Insights
Online advertising in Australia is rapidly expanding, driven by evolving consumer habits and the increasing shift towards digital platforms. With businesses looking to reach their target audiences more effectively, the demand for online advertising services continues to surge. Here’s why it’s essential for your business to pay attention to this growing trend and make online advertising a central part of your marketing strategy.
Growth of the Online Advertising Market in Australia
Australia’s online advertising market is experiencing remarkable growth. In the financial year 2023-2024, internet advertising expenditure reached an impressive $15.6 billion, marking a significant 9.7% increase from the previous year. This growth is expected to continue, with the Australian online advertising market projected to reach $17.1 billion by 2025. This 5.1% compound annual growth rate (CAGR) between 2020 and 2025 highlights the increasing importance of online digital marketing and its role in business success.
The Dominance of Social Media Advertising
A key driver of online advertising growth in Australia is social media advertising. By 2029, the market for social media ads in Australia is projected to hit $6.52 billion, growing at a rapid 8.35% CAGR. Social media platforms like Facebook, Instagram, and LinkedIn have become indispensable tools for businesses looking to target specific demographics with tailored advertising campaigns. These platforms provide robust targeting capabilities, enabling businesses to reach users based on interests, behaviors, age, location, and other key factors.
Why Online Advertising is Crucial for Businesses
The dramatic rise of online advertising signals that businesses need to adapt to the digital age. More Australians are spending time online than ever before, whether through social media, news websites, eCommerce platforms like Shopify, or search engines. As consumers increasingly turn to the internet for information, shopping, and entertainment, online advertising provides businesses with the opportunity to connect with their target audiences at the right moment.
Moreover, the interactive nature of online ads allows businesses to collect valuable insights and data on consumer behavior. With these insights, businesses can refine their marketing strategies, create better-targeted ads, and improve their return on investment (ROI).
Online Marketing Statistics: Key Insights for Effective Campaigns
As online marketing continues to evolve, staying informed about the latest trends and marketing campaigns statistics is crucial for businesses aiming to maximize their digital presence. Recent data shows that engagement rates on social media and digital platforms are significantly impacted by the quality and relevance of content. Brands that prioritize high quality content, tailored to their audience, see higher interaction and conversion rates, making it an essential part of any successful marketing strategy.
Looking ahead, spending is projected to reach new heights as more businesses allocate larger portions of their budgets toward online marketing channels. This growth is driven by the increasing effectiveness of digital ads, social media engagement, and targeted content campaigns. With advanced tools and analytics, marketers can fine-tune their strategies to ensure they are reaching the right audience, delivering high-quality content, and achieving a higher return on investment (ROI).
By leveraging data-driven insights and focusing on creating valuable, engaging content, businesses can continue to improve their marketing efforts and stay ahead in a competitive online marketplace.
What This Means for Your Business
As online advertising continues to grow, it’s crucial to invest in the right strategies that will help your business thrive in a competitive digital landscape. Whether you’re using search engine ads, social media campaigns, display ads, or video marketing, it’s important to ensure that your ads are visible to the right people at the right time.
The beauty of online advertising lies in its measurable results. Unlike traditional forms of advertising like TV or print, digital ads provide real-time analytics, allowing you to track clicks, conversions, and overall campaign effectiveness. This data-driven approach means that businesses can optimize their advertising efforts and maximize their marketing budgets.
Why Explainer Videos Are a Powerful Marketing Tool?
One standout trend in today’s digital landscape is the rising effectiveness of explainer videos as a marketing tool. Studies show that users are far more likely to engage with short, informative videos that clearly outline a product or service’s value. In fact, landing pages with explainer videos can increase conversion rates by up to 80%.
These videos simplify complex ideas, build trust, and keep visitors on your site longer—all key factors that support SEO and digital ad performance. For Australian businesses looking to boost engagement and drive results, explainer videos are no longer optional—they’re essential.
Over to you
The growth of online advertising in Australia is a clear indication that businesses must embrace digital strategies to stay ahead. With billions of dollars being invested into online platforms and social media advertising, there’s no better time to strengthen your digital presence and drive more leads, sales, and engagement. Whether you’re just starting or looking to optimize your current campaigns, making online advertising a central focus of your marketing strategy will be crucial for long-term success.
Now that you know the latest online advertising statistics, you can apply them to your ads campaigns for better results.
If you’re looking for more insights and tips on how to create winning online advertising campaigns and digital marketing strategies, we’ve created an eBook that tells you how.
Need more help? Just reach out one of our top Australian SEO agency services experts who will be happy to assist.
Final words
Perhaps you’re shocked to find out how effective video marketing is at driving clicks. Maybe you’re not taking advantage of local search with your mobile marketing.
These digital marketing stats offer some surprising insight into the effectiveness of good digital marketing campaigns. Use them to inform the direction your campaigns take in the future.
Got questions?
Pushing traffic towards a website is an extremely important part of any digital strategy. But it’s the quality of that traffic that’s the true deciding factor.
Even a poor digital strategy can boost the traffic numbers. But it won’t provide a business with the quality that it needs to generate a return.
With all of this evidence, along with the many statistics shared in this article, you can now see just how vital digital marketing and digital marketing stats are for modern businesses.
But you might have questions? Or you might be wondering if SEO or PPC is the right choice for your business?
Are you an Australian Business? Need Help With Paid Ads and / or SEO? Then simply reach Out:
PPC Sydney | PPC Melbourne | PPC Brisbane | PPC Gold Coast | PPC Perth | PPC Adelaide | PPC Hobart | PPC Canberra
SEO Sydney | SEO Melbourne | SEO Brisbane | SEO Hobart | SEO Perth | SEO Adelaide | SEO Gold Coast | SEO Canberra | SEO Darwin

About the Author
Andrew Raso
Share