


- Home
-

- Blog
-
- Online Advertising Blogs
-
- Google Ads: What You Need to Know About CTR and Other Benchmarks
Google Ads: What You Need to Know About CTR and Other Benchmarks

Guide To Google Ads CTR and Important Benchmarks
You’ve decided that you need to invest in Google Ads, formerly known as Google Adwords, to get your business in front of more people.
So far, so good.
Key Takeaways
-
Top KPIs in Google Ads management include CTR, CPC, conversion rate, and CPA benchmarks.
-
Average CTR benchmarks sit at ~3.17% for search and ~0.17% for display ads.
-
Average CPC is approximately $2.69 for search and $0.63 for display, though niche variance applies.
-
Comparing CTR and CPC to industry benchmarks informs bid and budget decisions.
-
Evaluating conversion rate and CPA against norms ensures campaign efficiency and ROI focus.
With the right AdWords Management strategy and investment, you can reap amazing returns. After all, the pay-per-click statistics make for good reading.
But then the questions start rolling in:
- How quickly will we start getting leads?
- When will an AdWords campaign generate a return on investment (ROI)?
- How much of a return can I expect from the campaign?
That leads to you having questions of your own.
How much should you spend each month?
How do you plan out your strategy?
What is considered a high CTR (click-through rate)?
They’re all good questions.
To answer them, you need to understand the benchmarks that determine whether a Google AdWords campaign for the Google Search Network or the Google Display Network is a success or not.
But that just raises more questions. What are these benchmarks? And which ones are relevant to my sector?
This article aims to answer those questions and more.
Strap yourself in for a deep dive into Google AdWords Management, CTR and the KPIs that matter.
The PPC metrics that matter including Google Ads CTR
There are plenty of benchmarks that you can choose from when creating a Google Adss campaign.
From CTR benchmarks to benchmarks related to ad spend, it’s hard to pick the right ones.
For the purposes of our Google Ads Management guide, we’ll focus on the four most important.
The following benchmarks can help you assess what’s standard in your industry, giving you an idea of what results you should be shooting for and what’s even possible.
- Average Click-Through Rates
- Average Cost-Per-Click
- Average Conversion Rate
- Average Cost-Per-Action
Let’s cover how each of these benchmarks apply to different industries.
What every marketer should know: CTR benchmarks and PPC statistics to consider
Knowing key PPC metrics, industry benchmarks, and how to interpret them allows advertisers and agencies to understand their success relative to competitors.
But, while everyone wants to create unicorn ads that have the highest CTRs and best conversion rates, what’s a good metric for one industry isn’t necessarily good for another.
The following Wordstream Google AdWords Industry Benchmarks for 2020 can be essential in determining how you are performing compared to the competition.
Average click-through rate in Google Ads by industry
The click-through rate is a simple concept. It tells you how many people clicked on your ad after seeing it.
So, let’s say that 100 people saw your ad. If 10 people clicked it, you have a CTR of 10%. And that brings us back to one of the questions you might have asked yourself before starting your campaign:
What is the average CTR for Google Ads?
Across all industries, the average CTR stands at 3.17% for search and 0.17% for display. But let’s dig a little deeper.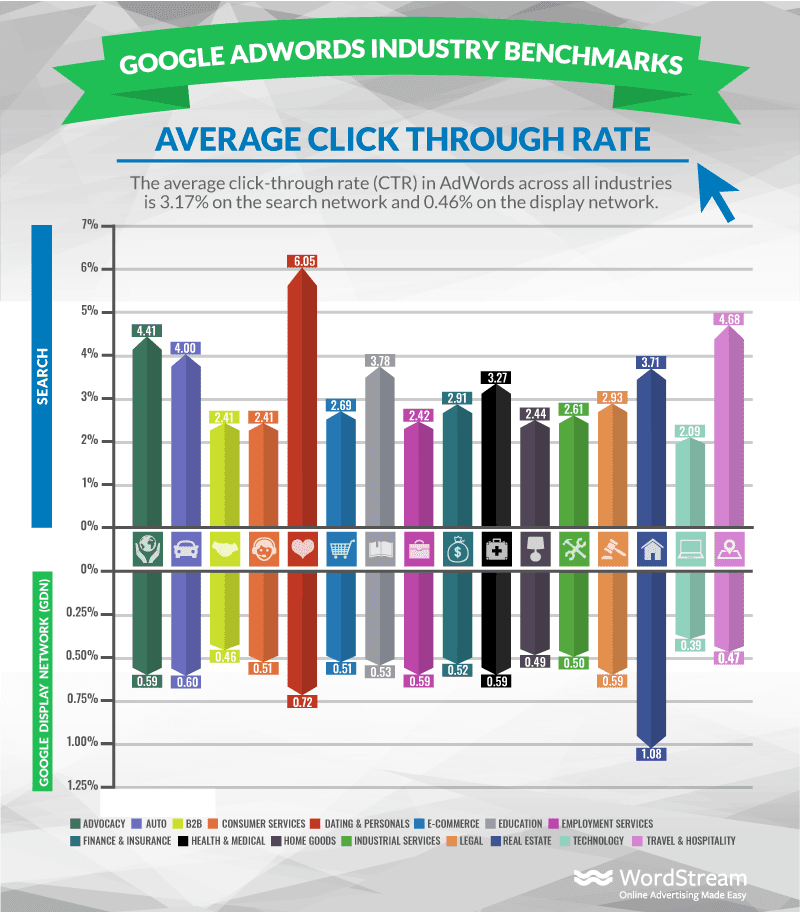
(Image Source: Wordstream)
What can we tell from these figures?
The first thing is that those in the personal services and dating sectors are the most likely to set high CTR benchmarks for themselves.
The data shows that these sectors have a CTR of 6.05%. Those in the advocacy and hospitality sectors also have higher CTRs of 4%+.
However, there are several sectors with much lower rates. Technology, for instance, barely cracks 2%.
Consumer and business-to-business services lie at less than 2.5%.
So, what is considered a good CTR?
Here’s the point. Your CTR benchmarks should depend on the industry that you’re in.
The above graph gives you some indication of what you can expect, based on your industry sector.
Use this information to create a benchmark that isn’t overly-ambitious. If you achieve a better CTR than the averages found in this data, you’ve built a campaign that exceeds industry expectations.
However, that doesn’t guarantee that the campaign will generate a solid return.
You still need the rest of these benchmarks to determine that.
Average cost-per-click in Google Ads by industry
Of course, having a great CTR doesn’t mean much if it costs you lots of money just to attract a single click.
That’s why the CPC (cost-per-click) benchmark is so important.
You’ll use this benchmark to essentially set a limit on how much you expect to spend each time a person clicks on your advert.
Here’s how it works. When somebody clicks on your ad, you pay a little bit of money for that click.
How much you spend depends on several factors, such as the competitiveness of the keywords you use and the quality of your ad copy.
What is the average CPC for Google Ads?
The average cost per click in Google Ads across all industries is $2.69 for search and $0.63 for display.
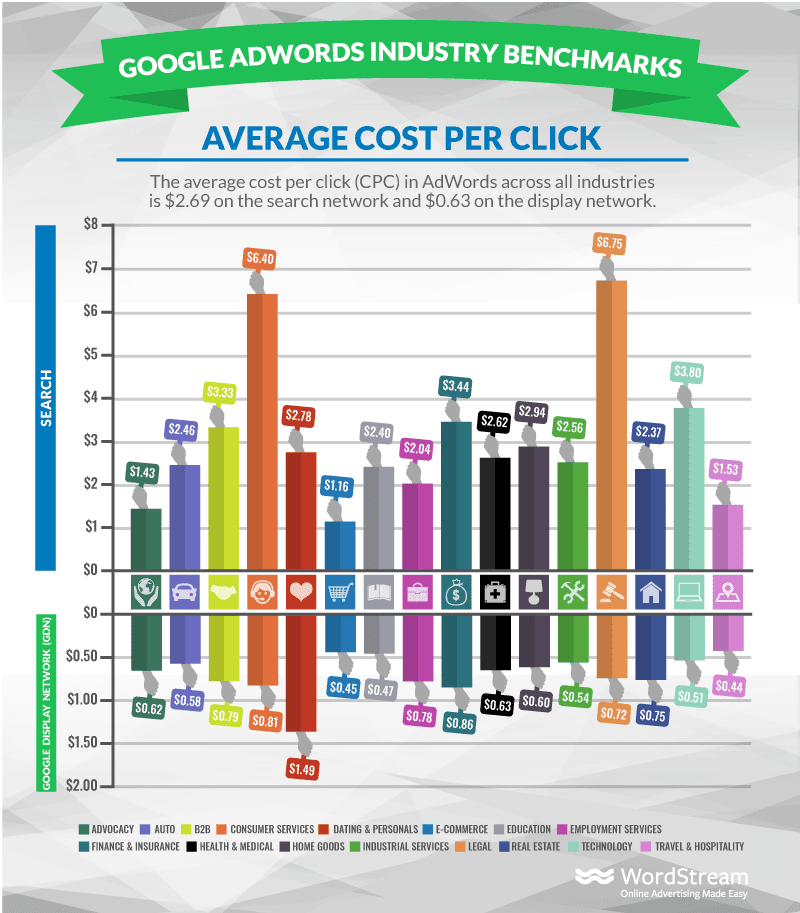
(Image Source: Wordstream)
But several industries will go above this. As you can see here, the legal and consumer services sectors tend to spend the most per click.
Both spend an average of $6+ per click alone. Remember that this isn’t $6 per converted customer.
It’s just the price you pay to get a potential customer to visit your website in the first place. Conversely, the advocacy and eCommerce sectors have much lower CPCs that barely go above $1.
Most other industries fall in the $3 range. That’s what you’re most likely to aim for. When setting your CPC benchmark, understand that the industry that you’re in will affect your figures.
You may have to spend more than organisations in other industries to attract the same number of clicks.
Average conversion rates in Google Ads by industry
Now we’re getting to the meat of these pay-per-click statistics.
Attracting people to your website is one thing. Getting them to become customers is how you achieve a good conversion rate and ROI.
What is a good Google ad conversion rate?
Firstly, it’s important to note that a conversion can mean different things for different industries.
For some, such as eCommerce websites, a conversion is a sale achieved via the ad. For others, it may be an enquiry from a customer or a booked appointment.
So to set your conversion benchmark, you first need to know what a conversion is for your business. From there, you must consider the industry statistics.
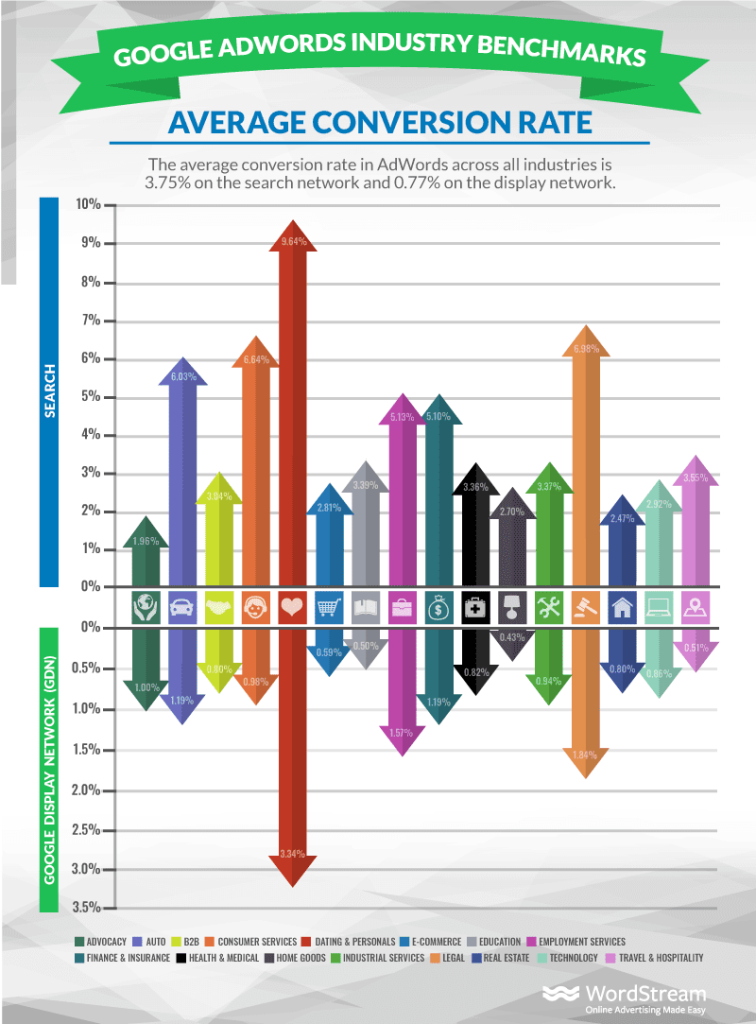
(Image Source: Wordstream)
As you can see here, the dating and personal services sectors have conversion rates on average over 9%. That’s well about the 3.75% average across all industries.
Advocacy groups suffer the most.
This sector’s benchmark stands at a tiny 1%. The legal sector manages to break past 6%. But real estate stands at less than 2.5%.
Several factors affect your conversion rate.
These include the quality of your ad, what you have to offer to the user once they’ve clicked the ad, and the general quality of your website.
Again, use these statistics to figure out what sort of conversion rate you can expect for your industry.
This will ensure you don’t set a 10% conversion benchmark for an industry that rarely pushes past the 2% mark.
Average cost-per-action in Google Ads by industry
The final benchmark in our AdWords Management is the CPA.
This is the average amount of money that you spend to actually acquire a paying customer. Your CPA tells you how much of a return you’re actually generating with your campaign. For example, let’s say that you have a CPA of $100.
If the average customer spends $1,000 on your services, that’s a good CPA. But if your average customer spends $50, you’re spending too much on your AdWords campaign.
In fact, you’re losing $50 for every customer that the campaign attracts. So the CPA is the key benchmark that determines the success of your campaign.
You may have a low CTR, high CPC, and low conversion rate. But a good CPA can balance those things out.
Conversely, you may have great figures for all of the other benchmarks. But if the average customer spend creates a bad CPA, the campaign isn’t a success.
Again, your CPA benchmark will vary depending on your industry.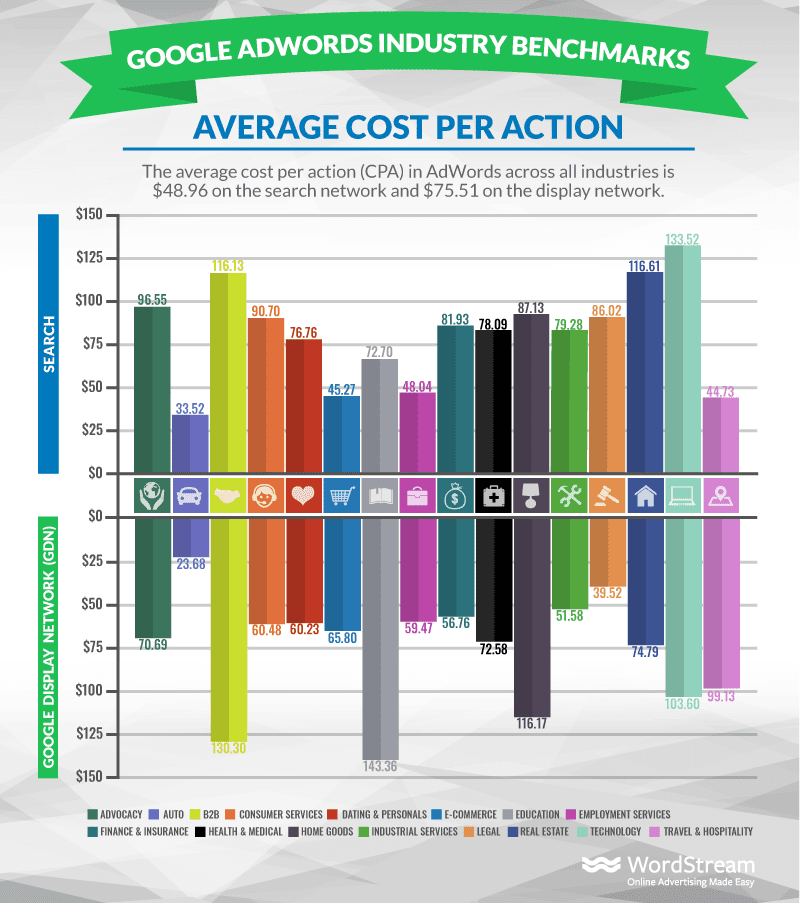
(Image Source: Wordstream)
What is the average CPA for Google AdWords?
Across all sectors, the average CPA stands at $48.96 for search and $75.51 for display. But if you’re in the technology sector, you’ll spend $133.52.
Real estate doesn’t have it much better. The CPA for that sector is $116.61. But the auto industry goes in the opposite direction. It hits a CPA of $33.52.
Compare these figures to the amount of money that you earn from each paying customer that your campaign attracts.
For example, those in the technology sector may think that a $133.52 CPA is quite high. But if you achieve a sale of a $2,000 computer per customer, it actually looks quite low. Here’s the point.
The success of your campaign depends as much on how much your customers spend as it does on the amount you spend to attract them.
The CPA benchmark tells you if you’re generating a return on investment and lets you know how efficient your AdWords campaign is.
The Burning Questions
The above portion of this Adwords Management guide covers the most important benchmarks and offers some interesting pay-per-click statistics.
Now, let’s look at some of the other questions that you may have about setting benchmarks.
1. Have PPC benchmarks changed during COVID-19?
With global events often impacting PPC performance, it’s no surprise that COVID-19 has had its impact on Google Ads performance for several different industries.
While some businesses are experiencing increased volume during the pandemic, others have been hard hit. Nonetheless, advertising remains essential for reaching customer acquisition goals.
To learn more about how the COVID-19 has impacted the average click-through rate (CTR) and the average cost-per-click (CPC) across a range of 21 industries, check out Wordstream’s in-depth report on PPC benchmarks during COVID-19.
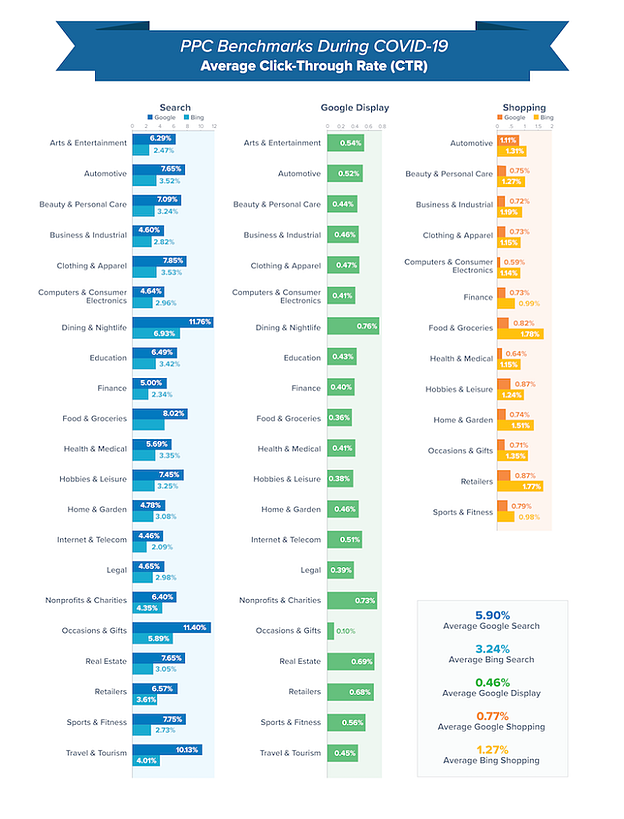
(Image Source: Think Results Marketing)
2. Is CTR always larger than conversion rate?
This is a common misconception.
The number of people that click on your ad will always be higher than the number of people that convert.
However, the rates measure those base numbers against other metrics. As a result, it’s entirely possible to get a conversion rate that’s higher than your CTR.
3. Why isn’t my Google Ads campaign hitting these benchmarks?
There are several reasons why your campaign might struggle. Landing pages are a big one.
If you have a poor landing page, people just bounce away instead of converting. You may get a great CPC. But your CPA shoots up because your landing page isn’t doing the job.
There are more technical issues too.
You may have used Broad Match on your short-tail keywords, which means you’re spending money on irrelevant clicks. Or, you might not use negative keywords effectively.
Maybe you’re not targeting people with the right ads. Too many people think a single ad campaign works across the board.
But someone at the awareness stage of the sales funnel isn’t going to spend money on a product just yet. If that’s what your ads want from that audience segment, they’re not going to succeed.
There are all sorts of things that can go wrong.
Generally, it boils down to not paying close enough attention to the data. Most don’t hit their benchmarks because they’re not adapting their campaigns over time.
4. Does lots of low-cost clicks mean my strategy works?
It depends. If those clicks lead to conversions, then your strategy is working.
However, lots of clicks means nothing if none of those people become customers.
CTR benchmarks are important for determining how visible your campaign is.
But it’s how many people convert and your average CPA that shows the true ROI, and ultimately the success, of the campaign.
5. Is Google AdWords the only PPC network available?
These figures come from WordStream’s analysis of thousands of Adwords campaigns.
But there are plenty more advertising networks available to you. Bing has its own network, as do social networks such as Facebook and Instagram.
In fact, choosing the right ad network is an important part of the success of your campaign.
You may find that you can attract more of your target audience using Facebook ads than Google ads, for example.
6. What is Quality Score and how can I improve it?
Quality Score is essentially a rating that Google attaches to search and display ads made using its AdWords network.
It checks the relevance of the ad against its keywords and your landing page. A great ad that lands on a relevant page will achieve a high quality score.
So, why is yours at the lower end of the scale?
It could be for the following reasons:
- The keywords you’ve chosen don’t relate well enough to your ad copy.
- You have a bad landing page.
- Your AdWords account has performed poorly in the past.
- The ad has a low CTR
Relevance is the key to improvement.
Build landing pages that offer exactly what a visitor wants when they click on the ad.
Target the campaign too. Don’t try and get ads to display for keywords that aren’t relevant to them. A bad Quality Score is usually the result of a poorly managed campaign.
And it matters. The lower your Quality Score falls, the higher your CPC becomes. Quality Score has a direct impact on your benchmarks.
7. How can I improve my AdWords performance?
There isn’t a catch-all answer to this question as it depends on the quality of the campaign that you’re running.
Some basic tips to improve AdWords performance include the following:
- Ensure you’re not paying too much for ads that only achieve average positioning.
- Create ad copy that’s both attractive and relevant to the ad’s landing page.
- Make sure your website looks professional enough for people to trust when they arrive.
The above can help.
But in many cases, making improvements requires lots of tweaking based on the data that you have about your industry and current campaigns.
The final word
As you can see, just checking the amount of traffic that comes to your website via AdWords isn’t enough.
You need to measure how much that traffic costs to obtain and what people do once they reach your website.
A combination of the four key benchmarks in this article will help you do that.
You’ll figure out how many people arrive on your site, how much it costs to get them there, and how many of them actually convert into customers.
Crucially, you’ll also work out how much it costs you to get a customer via your current AdWords campaign. You can use this data to answer the key questions about what you can expect from your campaign.
As importantly, you can also use these benchmarks to work out where you need to improve.
Got questions?
Pushing traffic towards a website is an extremely important part of any AdWords Management strategy.
But it’s the quality of that traffic that’s the true deciding factor.
Even poor campaigns can boost the traffic numbers. But it won’t provide a business with the quality that it needs to generate a return.
With all of this evidence, along with the many statistics shared in this article, you can now see just how vital AdWords is for modern businesses.
But you might have questions? Or you might be wondering if Adwords/PPC is the right choice for your business?

About the Author
Andrew Raso
Share